


最新下载
热门教程
- 1
- 2
- 3
- 4
- 5
- 6
- 7
- 8
- 9
- 10
linux中gnuplot绘制性能监控图使用
时间:2022-11-14 22:08:11 编辑:袖梨 来源:一聚教程网
YPE html PUBLIC "-//W3C//DTD HTML 4.0 Transitional//EN" "http://www.***w3.org/TR/REC-html40/loose.dtd">
YPE html PUBLIC "-//W3C//DTD HTML 4.0 Transitional//EN" "http://www.w***3.org/TR/REC-html40/loose.dtd">
一、安装
目前的最新版为4.6.5,这里不再列出源码包的方式进行安装,因为常用的linux系统源里都有该包:
| 代码如下 | 复制代码 |
|
//centos/redhat等rpm包安装 |
|
二、使用及示例
gnuplot有两种绘图方式,一种是交互式,一种是直接配置好相关参数直接运行。(这点和python相似)
交互式方式的如果想直接将图形展示,需要x11终端支持。这里不再具体示例,有兴趣的可以参看gnuplot中文手册参看示例或官方示例。下面以结合第二种方式为例,展示一个完整的示例:
例1、gnuplot绘制CPU使用图
sar获取 cpu信息并输出到文件
| 代码如下 | 复制代码 |
|
sar -u 1 10 | head -n -2 | tail -11 | grep . > /var/www/html/monitor.data |
|
文件内容格式如下:
| 代码如下 | 复制代码 |
|
#cat monitor.data |
|
编辑monitor.conf配置文件,以备gnuplot读取执行:
| 代码如下 | 复制代码 |
|
# cat monitor.conf |
|
具体输出的图形如下:
gnuplot
可以写一个脚本每隔一分钟执行一次:
| 代码如下 | 复制代码 |
|
# cat checkcpu.sh |
|
可以再配合一个简单的html页面,每一秒钟刷新一次,html内容如下:
| 代码如下 | 复制代码 | |
|
|
||
function refresh(){
window.location.reload();
}
setTimeout('refresh()',1000);
例2、gnuplot绘制负载图
| 代码如下 | 复制代码 |
|
[root@localhost~]# cat /opt/cpuload.gnuplot |
|
同样,可以利用html展示:
| 代码如下 | 复制代码 |
|
[root@localhost ~]# cat /var/www/html/gnuplot.html Performance ChartsLOAD Acerage |
|
以上脚本也可以利用crontab进行绘图。
当然如果想自制监控平台的话,还可以配合php、mysql等进行入库与图形展示。这里也只是列了两个小示例,gnuplot的使用场景不止这些。
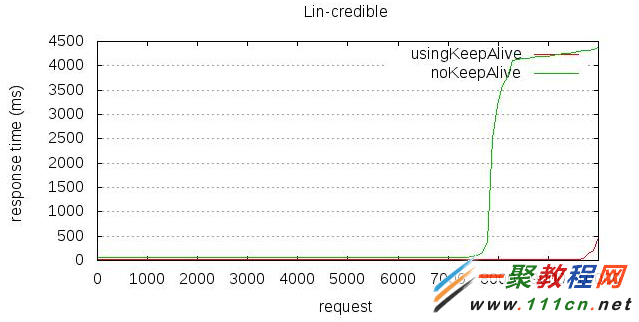
利用apache做压力测试时,也可以用其配合,直接的以图形展示。
| 代码如下 | 复制代码 |
|
files----> keep.data nokeep.data keepalive.output shell> yum install -y gnuplot ///gnuplot--->画图软件! |
|
--------------------------keepalive.output---------------------------------------
[plain] view plaincopy
| 代码如下 | 复制代码 |
| #output as png image set term png enhanced font '/usr/share/fonts/liberation/LiberationSans-Regular.ttf' # ls /usr/share/fonts/liberation/LiberationSans-Regular.ttf ==>验证是否有该字体! #save file to png file set output "keepalive.png" ///输出图片文件名 #graph title set title "Lin-credibe" ///图片标题 #nicer aspect ratio for image size set size 1,0.7 # y-axis grid set grid y # x-axis label set xlabel "request" #y-axis label set ylabel "response time (ms)" plot "keep.data" using 9 smooth sbezier with lines title "usingKeepAlive", "nokeep.data" using 9 smooth sbezier with lines title "noKeepAlive"//no white space |
|
同样,利用tpcc-mysql做mysql性能测试时,也可以利用gnuplot进行绘制性能图。示例。
一 下载工具
首先,安装bzr 客户端
# yum -y install bzr
下载tpcc-mysql过程中遇到的问题
| 代码如下 | 复制代码 |
| # bzr branch lp:~percona-dev/perconatools/tpcc-mysql bzr: ERROR: Couldn't import bzrlib and dependencies. Please check the directory containing bzrlib is on your PYTHONPATH. Traceback (most recent call last): File "/usr/bin/bzr", line 102, in import bzrlibpython ImportError: No module named bzrlib |
|
提示找不到 bzrlib 模块,因为调用Python,建议升级到2.6版本
解决方法:
| 代码如下 | 复制代码 |
| # find / -name bzrlib -print /usr/lib64/python2.4/site-packages/bzrlib |
|
定义环境变量:
| 代码如下 | 复制代码 |
|
|
|
再次下载ok.
| 代码如下 | 复制代码 |
| #bzr branch lp:~percona-dev/perconatools/tpcc-mysql You have not informed bzr of your Launchpad ID, and you must do this to write to Launchpad or access private data. See "bzr help launchpad-login". Branched 48 revision(s). bzr: warning: some compiled extensions could not be loaded; see |
|
二 编译安装
进入源码目录
| 代码如下 | 复制代码 |
|
|
|
三 初始化测试库环境
make命令会在tpcc-mysql目录下生成 tpcc 命令行工具 tpcc_load ,tpcc_start
tpcc_load 提供初始化数据的功能
tpcc_start 进行压力测试
用法:
# ./tpcc_load --help
tpcc_load [server] [DB] [user] [pass] [warehouse]
Server: 服务器名
DB: 数据库名
user: 用户名
pass: 密码
Warehouse: 仓库的数量
| 代码如下 | 复制代码 |
| #./tpcc_start --help tpcc_start -h server_host -P port -d database_name -u mysql_user -p mysql_password -w warehouses -c connections -r warmup_time -l running_time -i report_interval -f report_file |
|
介绍一下各个参数的用法
-h server_host: 服务器名
-P port : 端口号,默认为3306
-d database_name: 数据库名
-u mysql_user : 用户名
-p mysql_password : 密码
-w warehouses: 仓库的数量
-c connections : 线程数,默认为1
-r warmup_time : 热身时间,单位:s,默认为10s ,热身是为了将数据加载到内存。
-l running_time: 测试时间,单位:s,默认为20s
-i report_interval: 指定生成报告间隔时长
-f report_file: 测试结果输出文件
注意
tpcc 默认会读取/var/lib/mysql/mysql.sock 这个socket位置,如果你的测试环境的mysql socket不在相应路径的话,就需要做个软连接,或者通过TCP/IP的方式连接测试服务器。
准备工作:
| 代码如下 | 复制代码 |
|
|
|
1 创建五个数据仓库
| 代码如下 | 复制代码 |
| #./tpcc_load localhost tpcc root "123456" 5 ************************************* *** ###easy### TPC-C Data Loader *** ************************************* [server]: localhost [port]: 3306 [DBname]: tpcc [user]: root [pass]: 123456 [warehouse]: 5 TPCC Data Load Started... Loading Item .................................................. 5000 |
|
.................................................. 10000
忽略部分输出结果
四、进行测试
使用tpcc_start 进行5个线程的测试,热身时间为120秒, 测试时间为1小时 !
| 代码如下 | 复制代码 |
| # ./tpcc_start -hlocalhost -d tpcc -u root -p "123456" -w 5 -c 5 -r 120 -l 300 - >tpcc-output-log | |
五、生成图表
首先写一个脚本获取数据源:
| 代码如下 | 复制代码 |
|
# cat tpcc-output-analyze.sh |
|
这个脚本就是对 tpcc-output-nobinlog 的第一列与第二列进行运算。
| 代码如下 | 复制代码 |
|
|
|
绘图过程:
| 代码如下 | 复制代码 |
|
#cat log.conf set terminal gif small size 480,360 #指定输出成gif图片,且图片大小为550×25 set output "tcpp.gif" #指定输出gif图片的文件名 set title "MySQL Performance" #图片标题 set style data lines #显示网格 set xlabel "Time/s" #X轴标题 set ylabel "Data" #Y轴标题 set grid #显示网格 plot "tpcc-graphic-data.txt" using 1:2 title "Total throughput" with lines #从tpcc-graphic-data.txt |
|
文件中读取第一列和第二列作为X轴和Y轴数据,示例名"Total throughput"
| 代码如下 | 复制代码 |
| #cat log.conf set terminal gif small size 480,360 #指定输出成gif图片,且图片大小为550×25 set output "tcpp.gif" #指定输出gif图片的文件名 set title "MySQL Performance" #图片标题 set style data lines #显示网格 set xlabel "Time/s" #X轴标题 set ylabel "Data" #Y轴标题 set grid #显示网格 plot "tpcc-graphic-data.txt" using 1:2 title "Total throughput" with lines #从tpcc-graphic-data.txt文件中读取第一列和第二列作为X轴和Y轴数据,示例名"Total throughput" |
|
运行生成tcpp.gif:
| 代码如下 | 复制代码 |
|
|
|
相关文章
- 灵兽大冒险新手开荒攻略 灵兽大冒险零基础快速上手与资源规划指南 04-05
- 逸剑风云决白帝剑器任务攻略 逸剑风云决白帝剑器全流程完成指南 04-05
- yandex引擎首页入口位置在哪 04-05
- 爆米花视频app如何查看我的钱袋 04-05
- 掌上同济如何绑定就诊卡 04-05
- 如何下载红果免费短剧官方版 04-05