一聚教程网:一个值得你收藏的教程网站

热门教程

asp.net生成数据饼图实现代码

时间:2022-06-25 06:10:26 编辑:袖梨 来源:一聚教程网

在实现数据Pie图之前,首先要确保在C盘的根目录存在"db.mdb"数据库,并且此数据库已经设定完毕,并且存在《在ASP.NET页面中实现数据棒图》一文中的数据。下面是ASP.NET实现数据Pie图的具体步骤,开发工具使用的是Visual Studio .Net,采用的是C#语言。

  1. 启动Visual Studio .Net。

  2. 选择菜单【文件】|【新建】|【项目】后,弹出【新建项目】对话框。

  3. 将【项目类型】设置为【Visual C#项目】。

  4. 将【模板】设置为【ASP.NET Web 应用程序】。

  5. 在【位置】的文本框中输入"http://localhost/Pie"。然后单击【确定】按钮,这样在Visual Studio .Net就会在当前项目文件所在目录中建立一个名称为"Pie"文件夹,里面存放是此项目的项目文件,项目中的其他文件存放的位置是计算机Internet信息服务的默认的Web站点所在的目录中新建的一个名称为"Pie"的文件夹中。具体如图05所示:


图05:新建一个ASP.NET项目对话框

  6. 把Visual Studio .Net的当前窗口切换到WebForm的代码编辑窗口,即:WebForm1.aspx.cs文件的编辑窗口。

  7. 在WebForm1.aspx.cs文件首部,用下列代码替换WebForm1.aspx.cs中导入命名空间的代码:

 代码如下 复制代码

using System ;
using System . Collections ;
using System . ComponentModel ;
using System . Data ;
using System . Drawing ;
using System . Web ;
using System . Web . SessionState ;
using System . Web . UI ;
using System . Web . UI . WebControls ;
using System . Web . UI . HtmlControls ;
using System . Drawing . Imaging ;
//下面程序中使用的ImageFormat类所在的命名空间
using System . Data . OleDb ;
//下面程序中使用到关于数据库方面的类所在的命名空间

  8. WebForm1.aspx.cs文件中的Page_Load事件处理代码中添加下列代码,下列代码的作用是打开数据库,读取数据,并以此数据形成数据Pie图:

 代码如下 复制代码
string sRouter = "c:db.mdb" ;
//获得当前Access数据库在服务器端的绝对路径
string strCon = " Provider = Microsoft.Jet.OLEDB.4.0; Data Source = " + sRouter ;
//创建一个数据库连接
OleDbConnection myConn = new OleDbConnection ( strCon ) ;
string strCom = " SELECT YF ,SL FROM Table01 ORDER BY YF" ;
myConn.Open ( ) ;
OleDbCommand myCommand = new OleDbCommand ( strCom , myConn ) ;
OleDbDataReader myOleDbDataReader = myCommand.ExecuteReader ( ) ;
//创建OleDbDataReader实例,并以此实例来获取数据库中各条记录数据
int [ ] iXiaoSH = new int [ 12 ] ;
//定义一个数组,用以存放从数据库中读取的销售数据
string [ ] sMoth = new string [ 12 ] ;
//定义一个数组,用以存放从数据库中读取的销售月份
int iIndex = 0 ;
while ( myOleDbDataReader.Read ( ) )
{
iXiaoSH [ iIndex ] = myOleDbDataReader.GetInt32 ( 1 ) ;
sMoth [ iIndex ] = myOleDbDataReader.GetInt32 ( 0 ) . ToString() + "月" ;
iIndex++ ;
}
//读取Table01数据表中的各条数据,并存放在先前定义的二个数组中
myConn . Close ( ) ;
myOleDbDataReader . Close ( ) ;
Bitmap bm = new Bitmap ( 600 , 300 ) ;
//创建一个长度为600,宽带为300的Bitmap实例
Graphics g ;
g = Graphics.FromImage ( bm ) ;
//由此Bitmap实例创建Graphic实例
g . Clear ( Color . Snow ) ;
//用Snow色彩为背景色填充此绘画图面
g . DrawString ( " ××公司××器件2002年度销售情况一览表" , new Font ( "宋体" , 16 ) , Brushes . Black , new Point ( 5 , 5 ) ) ;


//在绘画图面的指定位置,以指定的字体、指定的颜色绘制指定的字符串。即为图表标题
//以下代码是是实现图01中的右上部区域
//以上是在图01中为下面绘制定位

 代码如下 复制代码
Point myRec = new Point ( 515 , 30 ) ;
Point myDec = new Point ( 540 , 30 ) ;
Point myTxt = new Point ( 565 , 30 ) ;
g . DrawString ( "单位:万套" , new Font ( "宋体" , 9 ) , Brushes . Black , new Point ( 515 , 12 ) ) ;
for ( int i = 0 ; i < sMoth.Length ; i++ )
{
g . FillRectangle ( new SolidBrush ( GetColor ( i ) ) , myRec . X , myRec . Y , 20 , 10 ) ;
//填充小方块
g . DrawRectangle ( Pens.Black , myRec . X , myRec . Y , 20 , 10 ) ;
//绘制小方块
g . DrawString ( sMoth [ i ] . ToString ( ) , new Font ( "宋体", 9 ) , Brushes . Black , myDec ) ;
//绘制小方块右边的文字
g . DrawString ( iXiaoSH[i].ToString (), new Font ( "宋体", 9 ) , Brushes . Black , myTxt ) ;
myRec . Y += 15 ;
myDec . Y += 15 ;
myTxt . Y += 15 ;
}
//以下代码是根据从数据库中得到的数值大小,绘制扇型,并以相应色彩填充扇型,//从而构成图01中的Pie图
int iTatal = 0 ;
float fCurrentAngle = 0 ;
float fStartAngle = 0;
for ( int i = 0 ; i < iXiaoSH . Length ; i++ )
{
iTatal = iTatal + iXiaoSH [ i ] ;
}
for ( int i = 0 ; i < iXiaoSH . Length ; i++ )
{
//以下代码是获得要绘制扇型的开始角度
if ( i == iXiaoSH . Length - 1 )
{
fCurrentAngle = 360- fStartAngle ;
}
else
{
int iTemp = iXiaoSH [ i ] ;
fCurrentAngle = ( iTemp * 360 ) / iTatal ;
}
//根据参数绘制扇型
g.DrawPie ( Pens.Black , 100 , 40 , 250 , 250 , fStartAngle , fCurrentAngle ) ;
//以指定色彩填充绘制的扇型
g.FillPie ( new SolidBrush ( GetColor ( i ) ) , 100 , 40 , 250 , 250 , fStartAngle , fCurrentAngle ) ;
fStartAngle += fCurrentAngle ;
}
//画出图片的边框
Pen p = new Pen ( Color.Black , 2 ) ;
g . DrawRectangle ( p , 1 , 1 , 598 , 298 ) ;
//向客户端输出数据流,并以此数据流形成Jpeg图片
bm.Save ( Response . OutputStream , ImageFormat . Jpeg ) ;
9. WebForm1.aspx.cs文件中的InitializeComponent过程之后,添加下列代码,下列代码的作用是定义一个名称为GetColor函数,此函数的功能根据索引号得到相应的系统颜色:
private Color GetColor ( int itemIndex )
{
Color MyColor ;
int i = itemIndex ;
switch ( i )
{
case 0 :
MyColor = Color . Cornsilk ;
return MyColor ;
case 1 :
MyColor = Color . Red ;
return MyColor ;
case 2 :
MyColor = Color . Yellow ;
return MyColor ;
case 3 :
MyColor = Color . Peru ;
return MyColor ;
case 4 :
MyColor = Color . Orange ;
return MyColor ;
case 5 :
MyColor = Color . Coral ;
return MyColor ;
case 6:
MyColor = Color . Gray ;
return MyColor ;
case 7:
MyColor = Color . Maroon ;
return MyColor ;
case 8:
MyColor = Color . Azure ;
return MyColor ;
case 9:
MyColor = Color.AliceBlue ;
return MyColor ;
case 10:
MyColor = Color . Bisque ;
return MyColor ;
case 11:
MyColor = Color . BurlyWood ;
return MyColor ;
case 12:
MyColor = Color . Chartreuse ;
return MyColor ;
default:
MyColor = Color . Green ;
return MyColor ;
}
}

  至此,在上述步骤都正确执行后,在ASP.NET页面中实现数据Pie图的全部工作就完成了。此时单击快捷键F5,就可以得到如图01所示的数据Pie图了

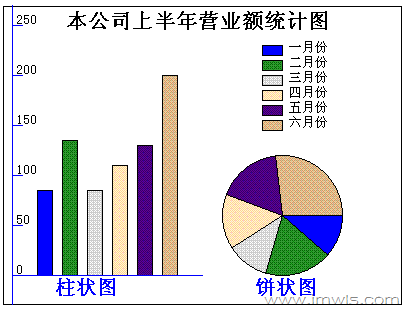
再看一个综合的实例

asp.net 柱状图 饼图 

代码如下

 代码如下 复制代码

using System;
using System.Collections;
using System.Configuration;
using System.Data;
using System.Linq;
using System.Web;
using System.Web.Security;
using System.Web.UI;
using System.Web.UI.HtmlControls;
using System.Web.UI.WebControls;
using System.Web.UI.WebControls.WebParts;
using System.Xml.Linq;
 
using System.Drawing;
 
namespace WebApplication1
{
    public partial class _Default : System.Web.UI.Page
    {
        private string[,] data = new string[6, 2];
 
        protected void Page_Load(object sender, EventArgs e)
        {
            DrawingAPic();
        }
 
        private void DrawingAPic()
        {
            int i;
            // 实例化Bitmap对象
            Bitmap objbitmap;
            objbitmap = new Bitmap(400, 300);
            Graphics objGraphics;
 
            // 实例化Graphics类
            objGraphics = Graphics.FromImage(objbitmap);
 
            // 填充背景色           
            objGraphics.Clear(Color.White);
 
            // 画圆
            objGraphics.DrawRectangle(Pens.Black, 1, 1, 398, 298);
 
            // 写标题
            objGraphics.DrawString("本公司上半年营业额统计图", new Font("宋体", 16, FontStyle.Bold), Brushes.Black, new PointF(60, 5));
 
            // 获取数据,这里模拟出6个月的公司业务数据,实际应用可以从数据库读取
            getdata();
 
            PointF monthcolor = new PointF(260, 40);
            PointF fontinfor = new PointF(285, 36);
 
            for (i = 0; i < = 5; i++)
            {
                //  画出填充矩形
                objGraphics.FillRectangle(new SolidBrush(getcolor(i)), monthcolor.X, monthcolor.Y, 20, 10);
 
                //画出矩形边框。
                objGraphics.DrawRectangle(Pens.Black, monthcolor.X, monthcolor.Y, 20, 10);
 
                //画出图例说明文字--data(i, 0)
                objGraphics.DrawString(data[i, 0], new Font("宋体", 10), Brushes.Black, fontinfor);
 
                //移动坐标位置,只移动Y方向的值即可。
                monthcolor.Y += 15;
                fontinfor.Y += 15;
            }
 
            // 遍历数据源的每一项数据,并根据数据的大小画出矩形图(即柱形图的柱)。
            for (i = 0; i <= 5; i++)
            {
                //画出填充矩形。
                objGraphics.FillRectangle(new SolidBrush(getcolor(i)), (i * 25) + 35, 270 - System.Convert.ToInt32(data[i, 1]), 15, System.Convert.ToInt32(data[i, 1]));
 
                //'画出矩形边框线。
                objGraphics.DrawRectangle(Pens.Black, (i * 25) + 35, 270 - System.Convert.ToInt32(data[i, 1]), 15, System.Convert.ToInt32(data[i, 1]));
            }
 
            //画出示意坐标
            objGraphics.DrawLine(new Pen(Color.Blue, 1), 10, 0, 10, 320);
            objGraphics.DrawLine(new Pen(Color.Blue, 1), 10, 270, 200, 270);
 
            // 在示意坐标上添加数值标志,注意坐标的计算
            for (i = 0; i <= 5; i++)
            {
                objGraphics.DrawLine(new Pen(Color.Blue, 1), 10, i * 50 + 20, 20, i * 50 + 20);
                objGraphics.DrawString((250 - i * 50).ToString(), new Font("宋体", 10), Brushes.Black, 12, i * 50 + 8);
            }
            //统计总销售额
            float scount = 0;
            for (i = 0; i <= 5; i++)
            {
                scount += float.Parse((data[i, 1]));
            }
 
            //定义画出扇形角度变量
            float scg = 0;
            float stg = 0;
            for (i = 0; i <= 5; i++)
            {
                //计算当前角度值:当月销售额 / 总销售额 * 360,得到饼图中当月所占的角度大小。
                float num = float.Parse(data[i, 1]);
                scg = (num / scount) * 360;
 
                //画出填充圆弧。
                objGraphics.FillPie(new SolidBrush(getcolor(i)), 220, 150, 120, 120, stg, scg);
 
                //画出圆弧线。
                objGraphics.DrawPie(Pens.Black, 220, 150, 120, 120, stg, scg);
 
                //  把当前圆弧角度加到总角度上。
                stg += scg;
            }
 
            // 画出说明文字
            objGraphics.DrawString("柱状图", new Font("宋体", 15, FontStyle.Bold), Brushes.Blue, 50, 272);
            objGraphics.DrawString("饼状图", new Font("宋体", 15, FontStyle.Bold), Brushes.Blue, 250, 272);
 
            // 输出到客户端
            objbitmap.Save(Response.OutputStream, System.Drawing.Imaging.ImageFormat.Gif);
 
        }
        // 为数组赋值
        // 即生成模拟业务数据
        private void getdata()
        {
            data[0, 0] = "一月份";
            data[1, 0] = "二月份";
            data[2, 0] = "三月份";
            data[3, 0] = "四月份";
            data[4, 0] = "五月份";
            data[5, 0] = "六月份";
            data[0, 1] = "85";
            data[1, 1] = "135";
            data[2, 1] = "85";
            data[3, 1] = "110";
            data[4, 1] = "130";
            data[5, 1] = "200";
        }
 
        // 产生色彩值,便于显示区别
        private Color getcolor(int i)
        {
            Color newcolor;
            i += 1;
            if (i == 1)
            {
                newcolor = Color.Blue;
            }
            else if (i == 2)
            {
                newcolor = Color.ForestGreen;
            }
            else if (i == 3)
            {
                newcolor = Color.Gainsboro;
            }
            else if (i == 4)
            {
                newcolor = Color.Moccasin;
            }
            else if (i == 5)
            {
                newcolor = Color.Indigo;
            }
            else if (i == 6)
            {
                newcolor = Color.BurlyWood;
            }
            else
                newcolor = Color.Goldenrod;
            return newcolor;
        }
    }
}

热门栏目